US Census Facts and Trends: The Rise of Non Employer Business

The total number of U.S. nonemployer establishments increased every year from 1997 to 2023 except during the financial crisis in 2008, according to the newly released Nonemployer Statistics.
Most nonemployers are self-employed individuals who operate their own business, which may be (but isn’t necessarily) their primary income source.
The U.S. Census Bureau data show annual growth of nonemployer establishments (those with no paid employees) almost always outpaced that of employer businesses (those with at least one paid employee). Nonemployers also represented a larger share of all U.S. businesses each year from 1997 to 2023 (Figure 1).
Post-pandemic numbers of nonemployer establishments spiked to the highest growth rates in nearly two decades: up 4.9% in 2021 and 4.7% in 2022.
Nonemployer Statistics (NES) includes all nonemployer establishments in a given year that were subject to federal income tax and had receipts of $1,000 or more ($1 or more for the Construction sector). NES data are classified by industry according to the North American Industry Classification System (NAICS).

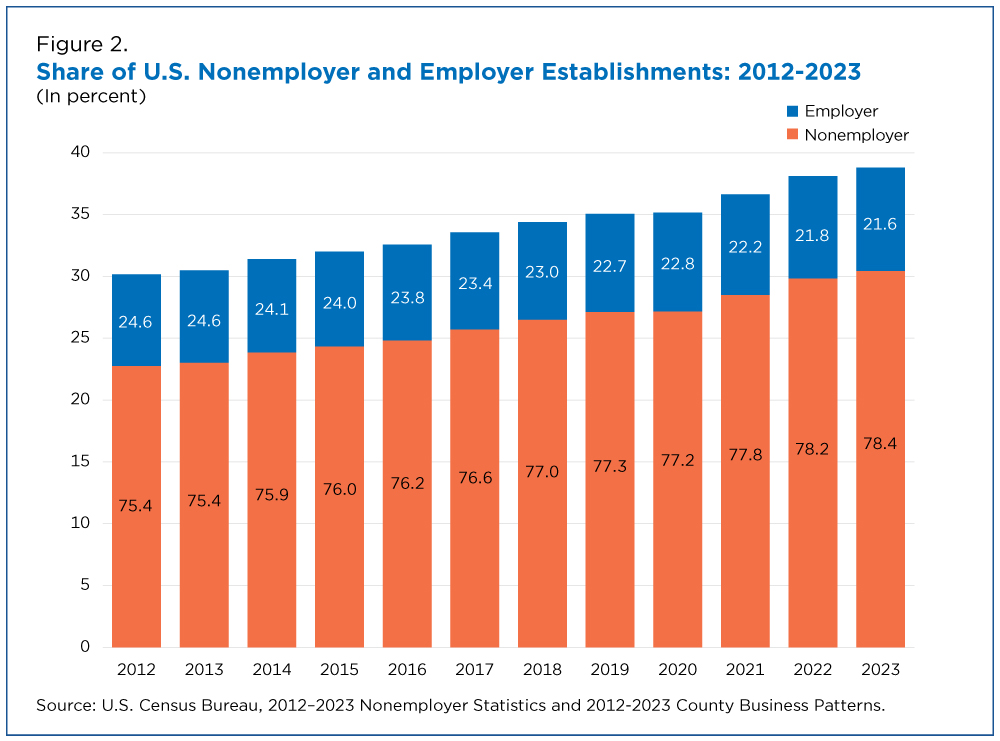
From 2012 to 2023, the total number of nonemployers grew an average 2.7% annually, while employers averaged only 1.1% growth year-over-year. During this same timeframe, nonemployers’ share of all U.S. businesses grew by 3%, shrinking employers’ share from 24.6% to 21.6% (Figure 2).
Nonemployer dominance was only interrupted by the COVID-19 pandemic in 2020. That year, the number of employer establishments grew 0.5%, outperforming the 0.2% increase in nonemployers (Table 1).
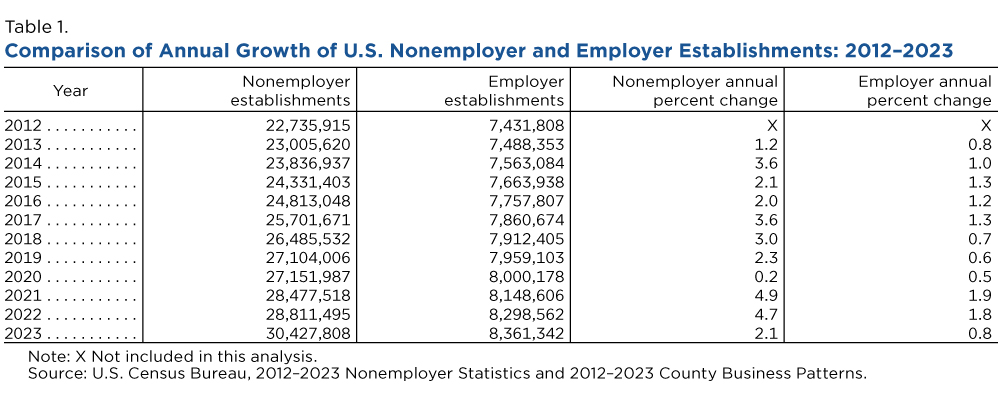
Post-pandemic numbers of nonemployer establishments spiked to the highest growth rates in nearly two decades: up 4.9% in 2021 and 4.7% in 2022, far outpacing the employer growth of 1.9% in 2021 and 1.8% in 2022. The data show nonemployer establishments climbed 2.1% in 2023, a slowdown compared to early post-COVID growth (Table 1).
The rising tide of nonemployer establishments since 2012, however, has not lifted all industries equally.
Growth Distribution
Despite the growth slowdown in 2023, 15 of 18 NAICS sectors saw an increase in the number of nonemployer establishments.
The top three sectors by percentage increase from 2022 to 2023 were the Accommodation and Food Services sector, which added 40,234 establishments (up 6.4%), followed by Transportation and Warehousing with 202,407 establishments (up 5.3%) and Utilities with 884 establishments (up 5.1%).
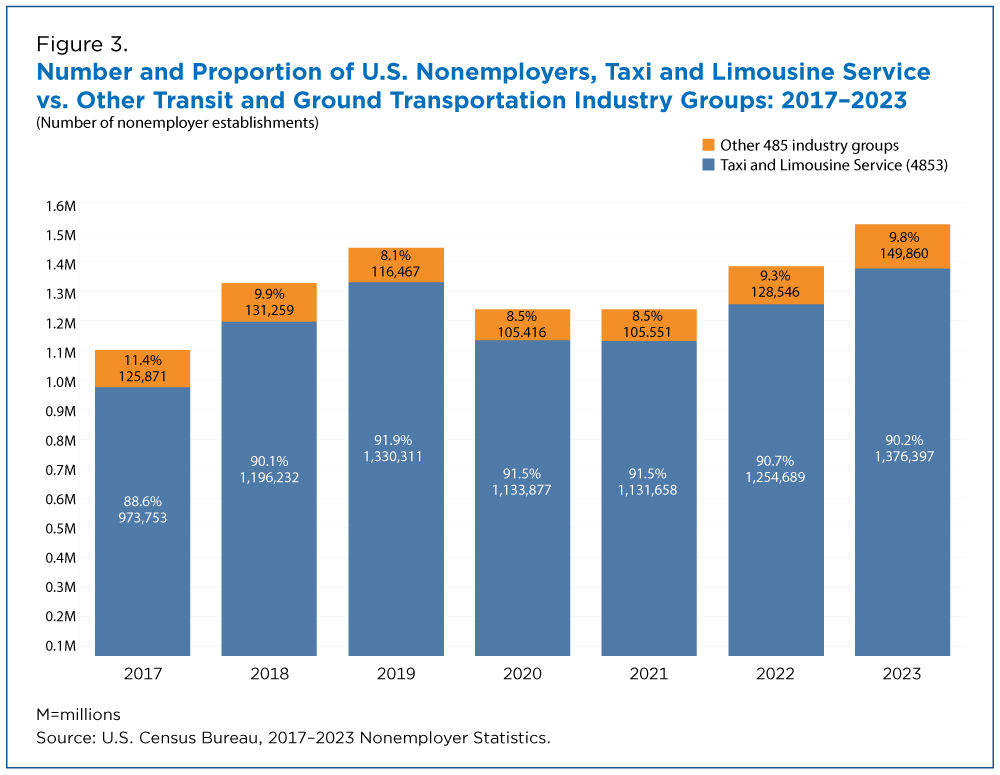
The Transit and Ground Passenger Transportation subsector added more nonemployer establishments than any other three-digit NAICS from 2022 to 2023 and surpassed its own pre-pandemic numbers for the first time.
The Taxi and Limousine Service industry fueled much of the increase, adding nearly 122,000 nonemployers to its ranks from 2022 to 2023 (Figure 3).
This growth contrasted with large decreases in subsectors like Health and Personal Care Retailers whose establishment total tumbled by 13.5%, losing 46,558 nonemployers between 2022-2023.
Retail Trade was the only NES sector to shrink between 2021 and 2022, slipping 8.4% to 2,170,322 establishments nationwide.
While some sectors saw reductions in establishments, others experienced a loss in receipts.
Receipts, referred to as “revenue” for the remainder of this article, are the total gross receipts (not including returns or allowances) a business receives from all sources before deducting expenses, as reported on annual business income tax returns. Gross receipts include sales of goods or services, investment income, and fees and commissions.
Hardest Hit Industries
Six NAICS sectors saw their revenue among nonemployers shrink in 2023. Three of these sectors had increases in establishment totals despite the decline in their revenue.
Mining, Quarrying, and Oil and Gas Extraction led the group of declining sectors by a wide margin, with a 10.1% drop in revenue between 2022 and 2023. The other five revenue-losing NAICS sectors had smaller reductions between 3.9% and 0.1% (Table 2).

Nonemployer establishments’ overall share of revenue in the U.S. economy also narrowed between 2022 and 2023. They accounted for approximately 6.4% ($1.8 trillion) of 2023 U.S. current-dollar gross domestic product, about 0.4% less than in 2022.
States of Change
While no U.S. state experienced a decrease in overall nonemployer establishments between 2021 and 2022, Louisiana, Georgia, Alabama, and the District of Columbia did see decreases in the number of these establishments from 2022 to 2023 (2.7%, 1.0%, 0.3%, 0.2%, respectively).
Declining population may have played a role in Louisiana’s loss of 11,708 nonemployer businesses. The state lost 5,616 people during the same period according to Census Bureau population estimates — the only state to experience a dip in both population and nonemployer establishments.
The geographically diverse trio of Delaware, Florida and Wyoming saw the largest percentage gain in nonemployer establishments between 2022 and 2023 (5.1%, 5.0% and 4.8%, respectively).
What’s Next?
The Census Bureau plans to re-release the 2023 NES later this year, alongside the Annual Integrated Economic Survey (AIES), with the data aligned to the 2017 NAICS codes. This joint AIES-NES release will feature national nonemployer and employer revenue broken out by approximately 430 NAICS codes.
To learn more about the impact of NAICS codes on data, view this Census Bureau webinar.
Travis Shoemaker is a writer/editor for America Counts in the Census Bureau’s Communications Directorate.
More News from Raritan
- Hillsborough Boys Tennis Opens Season 4–0 With Wins Over State Top‑20 Teams Tennis News from Hillsborough.
- Franklin Township Celebrates Resident and FHS Graduate Joining the National Guard Franklin Township Police shared their pride and well‑wishes.